
Jimmy Anderson Florez Zuluagaa, Jesús Francisco Vargas Bonillab, Juddy K. Reinac
In aviation, the meteorological phenomena are one of the most Important aspects to be considered In all fly stages, from planning to landlng.The development of nowcasting systems In meteorology applied to aviation can support the decision-making process for air traffic controllers and pilots, facilitating the meteorological variables analysis and providing a first Interpretation available to all the users of the air system.
For this reason, the Center for Technological Development for Defense (CETAD) has as main objective In this document to describe the results of the development of a systematized methodology that uses Intelllgenttechnlques for the detection and Identification and monitoring of any type of training that by Its characteristics can represent a risk to the aviation, generating In turn Information of support to the air traffic controller.
For this, It Is necessary to detect the convective formations, to classify them, to filter the noise and to Individualize them. These types of processes can be automated through the Intelligent analysis of products available through the MET Service of Air Navigation Services Providers, like the Colombian Civil Aviation (UAEAC) and the multlspectral satellite imagery.
After detection, a group of characteristics allowing the developmet of efficient algorithms capable of monitoring the behavior of the convective formation must be determined.That allows generating forecasts of the characteristics of the convective systems in the short term and this requires to know other variables such as the wind motion In the areas of analysis. This kind of applications integrated with air traffic control systems would reduce the risks due to meteorological factors. This work brings a procedure based on the combination of different techniques like histograms identification and neural network processing, among others, to identify a potentially hazardous phenomenon and to follow it in time and space. The use of a user-friendly interface let any user have a phenomena interpretation for supporting the decision-making process.
Keywords: Air control systems, meteorological analysis, artificial intelligence, satellite pictures, next generation systems, ATC, air safety, meteorological risk, cumulonimbus, tower cumulus, Air risk management.
en la aviación, los fenómenos meteorológicos son uno de los aspectos más importantes para tener en cuenta en todas las etapas de vuelo, desde la planificación hasta el aterrizaje. El desarrollo de sistemas de predicción meteorológica aplicados a la aviación puede apoyar el proceso de toma de decisiones de los controladores de tráfico aéreo y los pilotos, facilitando el análisis de las variables meteorológicas y proporcionando una primera interpretación a disposición de todos los usuarios del sistema aéreo.
Por esta razón el Centro de desarrollo Tecnológico para la Defensa (CETAD) tiene como principal objetivo en este documento describir los resultados del desarrollo de una metodología sistematizada que utiliza técnicas Inteligentes para la detección, Identificación y seguimiento de cualquier tipo de formación que por sus características pueda representar un riesgo para la aviación, generando a su vez Información de soporte al controlador aéreo.
Para esto es necesario primero Identificar las formaciones convectivas, clasificarlas, filtrar el ruido e Individualizarlas. Este tipo de procesos pueden ser automatizados a través del análisis Inteligente de productos disponibles en cualquier sistema aéreo como las Imágenes satelltales multlespectrales. Posterior a una Identificación, se deben determinar un grupo de características que permitan desarrollar algoritmos eficientes capaces de realizar un seguimiento del comportamiento de la formación convectiva, que permita generar pronósticos de las características de los sistemas convectivos en el corto plazo, para lo que se requiere conocer otras variables como el viento en las áreas de análisis.
Este tipo de aplicaciones Integradas a los sistemas de control de tráfico aérea disminuirían los riesgos debidos factores meteorológicos.
Palabras clave: sistemas de control de aire, análisis meteorológico, Inteligencia artificial, Imágenes satelltales, sistemas de próxima generación, ATC, seguridad aérea, riesgo meteorológico, cumulonimbus, cúmulo de la torre, gestión del riesgo del aire.
Na aviação, os fenômenos meteorológicos são um dos aspectos mais importantes a ter em conta em todas as etapas do vôo, do planejamento ao pouso. O desenvolvimento de sistemas de previsão do tempo aplicados à aviação pode apoiar o processo de tomada de decisão de controladores e pilotos de tráfego aéreo, facilitando a análise de variáveis meteorológicas e fornecendo uma primeira interpretação disponível para todos os usuários do sistema de ar .
Por esta razão, o Centro de Desenvolvimento Tecnológico para a Defesa (CETAD) tem como objetivo principal neste documento descrever os resultados do desenvolvimento de uma metodologia sistematizada que utiliza técnicas inteligentes para a detecção, identifcação e monitoramento de qualquer tipo de treinamento que, devido às suas características pode representar um risco para a aviação, gerando, por sua vez, informações de suporte para o controlador de tráfego aéreo. Para isso, é necessário primeiro identifcar as formações convectivas, classifcá-las, fltrar o ruído e individualizá-las. Este tipo de processo pode ser automatizado através da análise inteligente de produtos dlsponívels em qualquer sistema de ar, como imagens de satélite multispectral.
Após uma identifcação, um grupo de características deve ser determinado que permite o desenvolvimento de algoritmos efcientes capazes de rastrear o comportamento da formação convectiva, o que permite gerar previsões das características dos sistemas convectivos no curto prazo, para o qual é necessário Conheça outras variáveis como o vento nas áreas de análise.
Este tipo de aplicações integradas aos sistemas de controle de tráfego aéreo reduziria os riscos devidos a fatores meteorológicos.
Palavras-chave: Sistemas de controle de ar, análise meteorológica, inteligência artifcial, imagens de satélite, sistemas de próxima geração, ATC, segurança aérea, risco meteorológico, cumulonimbus, cluster de torre, gerenciamento de risco aéreo.
In the last years many works dealing with the identification, monitoring and tracking of meteorological systems as storms, typhoons, etc., have been published, like those by Cheng, Chandan and Kovordányi [1 ], [2], where patterns in the of convective systems were detected using different methods such as hidden Markov chains. Also genetic algorithms, self-organized mapping systems and techniques of nearest neighbor were used by Henke, Sieglaff and Pa-rikh in [3]-[5]. Furthermore, tracking techniques have been implemented using satellite image processing and neural networks (NN) in Chandan [5]. However, the considerable number of factors to be considered leads to the necessity of performing the analysis by areas, because clouds are one of the main sources of uncertainty in the development of models for climate prediction and its conformation depends on geographic conditions. Other examples of image-based detection are [1], [6], [7] where the algorithms used can detect volcanic ash, atmospheric gas concentration, reluctance and temperature atmospheric changes, dust, fires, smoke and clouds according to Mahani, Rillo, and Chethan [8]-[10].
On the other hand, air operations are one of the human activities more sensitive to weather condition and many of the Communications, Navigation and Surveillance systems for Air Traffic Management (CNS-ATM) are obsolete according to studies developed by Finke Ahlstrom and Jeon [11 HI 3] because they do not have automatic analysis and supporting systems for meteorological data. According to Rillo [9] this is one of the main causes of air accidents.
One of the most dangerous phenomena are convective clouds such as Cumulonimbus (Cb), nimbostratus (Ns), Cumulus or tower cumulus (TCB). These phenomena are related to electrical storms, severe rain and hail, lightning, icing and wind shear, which can affect the safety of aircrafts or generate stress during the fly yielding human and economic losses.
Federal Aviation Administration (FAA) and Eurocontrol recognize meteorology as a critical factor in aerial operation according to Ahlstrom and Jaggard [14].Thus, they are working in NEXTGEN and SESAR [15]-[18] to improve air operational control. These are programs that involve the use of intelligent systems to improve the air surveillance and allow to integrate other information like temporal and geospatial identification of weather formations [15], [16], [19], [13], that could affect the CNS-ATM system.Through this system, they try to reduce risks by allowing air traffic controllers and pilots to make decisions based on integrated information from air surveillance and meteorological sensors.
In Colombia, much of the information used by the aeronautical system comes from weather reports of meteorological station placed at the aerodromes called Meteorological Aerodrome Report (Metar) and images provided by the Geostationary Operational Environmental Satellite (GOES) [20], that covers all the country and provides images every 30 minutes in different spectra and resolutions covering the infrared (IR), Visual (VIS) and water vapor (WV) spectra.These images are widely used for monitoring convective systems according to Parikh [4].
Another available source of information in Colombia is the surveillance radar meteorological channel.This information is not used normally by the operators. In the Colombian Case that kind of information belongs to a primary radar that are used for air defense. For that use, the weather signals are interpreted like noise the main responsibility of the people using the system is to guarantee the legal use of (National Air Space) NAS, therefore in this country this signal are not used. In the documentation there are some approach to use the surveillance radar for meteorological detection like Stone and Anderson Work described in [21] and [22]. In this work for the weather channel of Airport Surveillance Radar-9 (ASR-9) they show the results of a simulations and validation to use digital signal and data processing techniques based on near-optimal target-detection in the Moving Target Detector (MTD) for detection of meteorological condition. In addition Weipert and Hannesen in [23], expose the possibility to use Eurocontrol Asterix format (All Purpose STructured Eurocontrol SuRvei-llance Information Exchange) to represent meteorological sensor combination products.
To integrate this information into an aerial surveillance system, it is necessary to interpret the data reported by the meteorological sensors, satellites and surveillance radar to detect and forecast dangerous conditions for flight, which could cause delay and troubles in the administration of the NAS, according to Harrington and Wiggins [24]-[26]. The Colombian Air Force integrates in a single web platform (the Institutional Meteorological System, SIMFAC) the information available from different sensors and some products of the Colombian adaptation of the Weather Research and Forecasting Model (WRF), which uses numerical prediction methods at mesoscale level to generate results for the operational forecast providing information to the country's air ecosystem users like icing graphs.
In this work, intend to describe a methodology proposed by CETAD that through image processing tools and artificial intelligence, allows to detect, individualize, analyze and follow up any type of convective formation as described above that can be at risk aviation, based on the information existing in the country, through data fusion and real-time processing techniques, in order to provide the operator or the air traffic controller with useful information to facilitate the analysis of data and thus provide more information in the support to the decisions making process.
Colombia is a country located in the equatorial zone, with different microclimates and areas of high relative humidity. This kind of factors favors the development of convective systems, like Cumulus, tower cumulus and in general vertical formation clouds. This means that all the atmosphere levels are covered by this clouds from low to high levels and are associated with storms, electrical storms, wind shear, ice, lightning, etc., affecting flight safety and air traffic organization.
The review of Colombian developments in this area does not shows works related to the aeronautical systems. According with data from the FAC Air Safety Department, between 2015 and 2016 at least five accidents happened in Colombia somehow related to meteorological conditions. Thus, it is necessary to improve the air control and decisions making support system in the country to increase the capability of response and to reduce the time analysis, following the example of FAA and Eurocontrol. Such a system should describe the current conditions and forecasting the meteorological effects of them, automatically supporting the meteorologist, forecaster or any aeronautical user, providing a tool for the identification, monitoring and immediate prediction of areas of influence of meteorological phenomena that could affect aeronautical operations and their behavior in the time.
Therefore, in this work, a process of identification, analysis, and monitoring is proposed and a nowcasting method based on influence areas is proposed. The system must integrate heterogeneous meteorological data serving as a support for the decision making. This information has been adapted to the country conditions and presented to the users of the aeronautical ecosystem in a user-friendly way so that they can properly interpret it. For evaluation of this system a web platform was designed in order to allow an expert group to validate and verify the data information. The expert group was conformed for air safety operations, meteorologist and engineers
The results presented here are part of a first exploration work developed by the Center for Aerospace Defense Technology Development (CETAD) on the potential of integrating artificial intelligence techniques to support human operations in the control of air operations.
Satellite images analysis has a wide range of applications in the field of meteorology, such as weather forecasts. Each image represents a channel with different information that could be used for different applications. For these work the images that have been used contain highlights, typically used for aeronautical environment, in order to use the same information used by any aeronautical user.
Nowadays in Colombia, the convective phenomena identification that could affect the aviation are mainly based on the analysis of Metar and satellite images of infrared (IR), water vapor (WV) and visual (VIS) spectra.The interpretation and visual classification of cloud types is done manually by experts. This process is significantly dependent on the experience of the person who performs the analysis, requiring time, training and personal
For automatic detection of convective system, based on Chetan, Peak, Desbois and Azimi-Sadjadi [10], [27]-[29], artificial intelligence (Al) and digital image processing (DIP) techniques are used typically to automate the meteorological pattern recognition. Other authors, like Yin and Qian, [7], have worked with unsupervised methods using propose intelligent segmentation techniques as a recognition method.
Convective systems(CS) are clouds formations produced by air ascent due to temperature differences caused by the heating of the earth surface which reduces the air density and consequently produces its ascent. This kind of phenomena has been extensively described by Rillo in [9], where the life cycle ofTCB and Cb is explained. The life cycle of CS is composed by developing, maturity and dissolution phases. The time duration can vary depending of meteorological area conditions and whether it is an independent or a composed cell.
Other source considered in this work is the icing. It is reported in three-hour periods by SIMFAC and other systems. These phenomena, according to FAC meteorologists and air safety specialists, [9], [14], [24], [30] area risk condition that must be considered in-flight planning by the pilot or by the air traffic control service.
Early detection CS would contribute to improve the air traffic efficiency and safety, because according to [23], 60% of delays are related with meteorological phenomena and many risks are due to meteorological condition too.
Convective cells detection must be done channel by channel to achieve an optimal result and characteristic extraction of any source. The VIS (0.52- 0.71 pm) captures the reflected solar radiation in the visible spectrum. According to [31], high reflectivity zones looks brighter and are related with a higher cloud density. Detecting the contrasts on this channel is possible to identify the shape of the clouds at low layers. The WV channel {5.8-73 pm) allows to see the distribution of clouds in the middle and high layers, according to [31]-[32]. It is a special type of infrared measurement that represent the temperature related with a presence of 1 mm of water vapor in the atmosphere. The IR (10.2-11.2 pm) detect the presence of formations high layers through a relation between altitude and temperature of clouds described in [8].
The icing pictures provides data for areas that have a high probability of presenting icing phenomenon. These pictures are products based on numerical models for the WRF that has been adapted by FAC for Colombian conditions. The icing occurs by adherence and accumulating of water particles with temperatures below 0 °C to the surface of the aircraft, causing weight gain, aerodynamic losses, loss of control surface, reduction of power, and even communications failures. Therefore, icing areas could be associated or not to convective phenomena.
To identify the patterns in the convective formations, C language and OPENCV libraries were used to digital image processing and IA libraries. Different kind of Al systems were implemented, in order to find the best results in the work. Vector network machines, histograms analysis, near neighbors, and NN were evaluated, the results show that neural networks had the best results in IR and WV channels with average of 94% for positive detection of convective system.
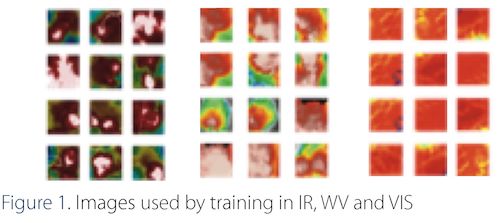
For the training, two sets of images were extracted for each channel. These images were taken from the SIMFAC database between the months of November 2016 and March 2017. The first one named "positive"consists of previously selected images that contain meteorological convective systems samples and the second set are images of cloud systems that do not correspond to bad weather conditions (negative).
For training, 3.394 IR images (from which 1.200 images were positive and the remaining negative ones) and 2.986 WV ones (972 representing vertical formations or positives) were used. Figure 1 shows a positive set for each channel. During the tests, different sample sizes of windows were used for positive and negative input picture, obtaining better results with a 50x50 pixels window.
The NN inputs were chosen based on the histogram of each channel. The final neural network configuration for IR channel was configured with 256 input neurons, 5 hidden layers with 15 neurons each and 1 neuron for the output layer. For the WV channel, because some histogram elements did not provide information, use only 172 input neurons, 3 hidden layers of 30 neurons each one and one output perceptron. For both networks, the propagation training method selected was backward with a symmetric sigma network function.
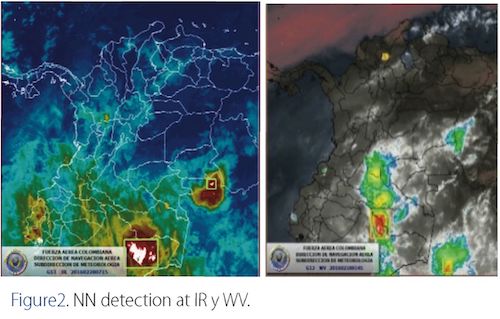
 For the verification, a sample of 1.350 convective formations for IR channel and WV channels was previously selected by experts from FAC meteorological database. The test was done with 2000 samples for IR and WV channels and the results were 96% and 93% of detection respectively. In Figure 2 an example is shown.
For the VIS image, the results with these techniques were not optimal, possibly due to variations in brightness in the visual image during the day. Flowever, according to [20] IR and WV analysis could be sufficient in the detection of vertical formations. Nevertheless, in this work any available channel will be used.
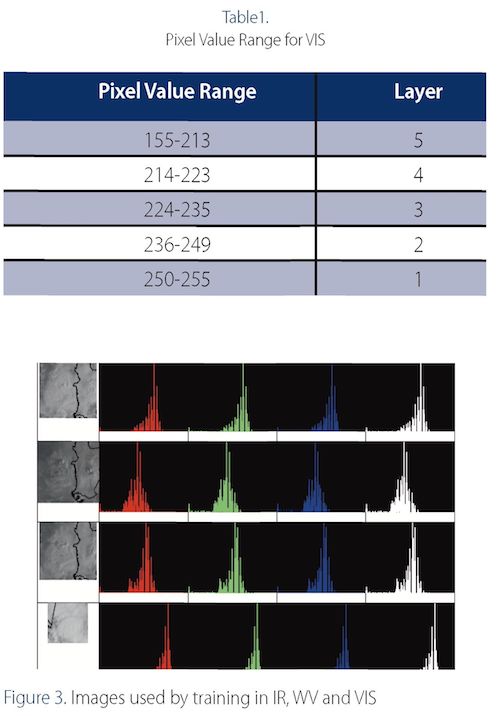
To do this, a brightness histogram equalization technique was implemented for VIS channel. After the equalization, an adaptive filtering is applied. The filter is based on a range of intensities obtained from a histograms analysis showed in table 1 and figure 3. Histograms classification allowed the possibility to update the range intensity automatically according to time equalization. In the training 5 layers were defined base on pixel color. This definition let the system related pixel range with Intensity range according to histograms scale, the system finds the evidence of bad weather conditions according to that scale. In the test, the result was a positive classification of 91% evaluated in 705 sample pictures for VIS images.
For detecting areas of interest in icing graphs, a similar process described for the visual channel is used. These graphs provide the areas with presence of ice using colors according to ice severity.The system through a histogram filter, select the values that indicate the presence of icing and apply a mask for noise elimination.
Other data source that is used is the Metar (Meteorological Aviation Routine Weather Report). It Is an International standard of codification used to emit reports of the meteorological observations by aerodrome each hour, and depends of landing measures and observations.The Metar provides information of weather 10 Km surrounded the aerodrome and brig local data such as temperature, winds, cloudiness, type of cloudiness, pressure, among others.
For that code the dictionary was defined, and a new NN was trained to recognized patterns such as wind, cloud position, temperature and Humidity data that will be used to define the condition of each aerodrome and the source contribution.This condition has a high importance because correspond to a direct local weather observation. Then if a convective system is reported the general decision System will consider it like a main area report, and will calculate the other channels according to this information. In other word, the metar is used by the system like test points, to verify the other channels information and it is stored in the data base.
After all sources process, are storage in a geospatial matrix based on WGS84 (standard World Geodetic System) system. The size of matrix depends of the source number that the system receives an it could be configurable. For the last step In the detection process the layers are merged to find the common conditions that could be used like a convective system presence evidence.
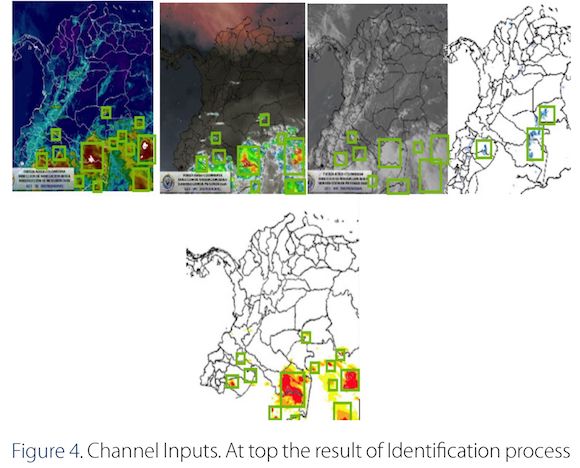
When a cell Is found In any channel, the system generates a rectangle with the minimum possible area surrounding the convective cellule, this Is showed in Figure 4.Then the fuzzy logic decision process makes comparisons for all channels looking for coincidences In the regions. Each channel will have a weight ranging between 1 and 100 that depends on the channel characteristics and expert estimation.
If coincidences are found between the same position in different sources based on a fuzzy logic decision process the system make the risk calculation of these convective system based on experts estimates, preprogramed in the system.The participation of each channel Is pondered and a new matrix dimension is created with the result of merged Information. For instance, in the night when the visual image does not report anything, the convective area detection could be done with IR and WV match according to [20]. For risk regions definition, it used at least this two channels and icing layer matching.
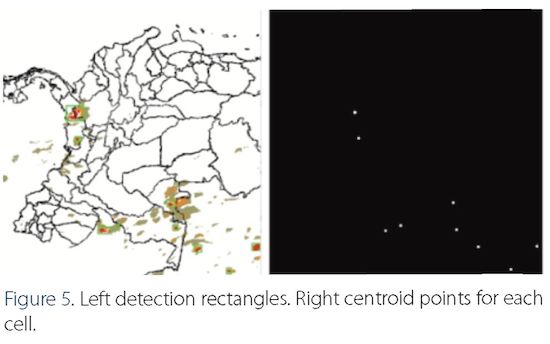
When convective formation is detected, the system extracts all available information by channel, such as the coldest point by frequency, geometric centroid, length and width of the formation, altitudes and risk levels and these characteristics are stored in the new layer generated by the system. Each cell detects is represented by a rectangle that has an intensity information resulting of the linear combination between the channels weight, where 100% represents a coincidence in the identification of convective cells in all the channels with the maximum intensity by channel.
Each convective cell is identified with a unique alphanumeric code and it is stored in a database with all information related with this cell. After the identification is done, a timeline is calculated and the convective cell is tracked in the next periods. For the case of the satellite images, 60 minutes or 2 times the data period were chosen for identification process. With this data, the system makes a comparison between the data at t-1, and t and integrates them with heterogeneous sources like metar with different periods.
The clouds tracking is described by Cheng, Chandan and Kovordányi in [1] and [2] like a complex problem due to the variations in the characteristics of the convective systems, among factors, such altitude, climate zone, wind, humidity between others. A convective clouds life cycle has a big variation in vertical formation because they could precipitate like rain, stay for a while, join with other proximity cells to form new systems, or move geographically which depends on other local variables for the area such as pressure, humidity, temperature and mainly wind. The minimum system update time is 30 minutes, time in which a formation could disappear, merge, stay or move according to the wind, caused by changes in pressure. All of these factors must be considered for tracking algorithm approach.
As part of the tracking process, it is necessary to individualize each cell through the determination of a unique group of characteristics that lets the system to identify each cell of convective conditions. After the system detect a convective cell and generate the characteristic the system labeled it with a unique tag. In a georeferenced matrix, the system storage all convective cell for that period and storage them.
Several methods were implemented to follow the cells. Some use the position of the cell as a function of several factors like xy coordinates, cells centroid and vertices longitude and latitude. Initially, the goodfeaturetotrack algorithm described by Zaccolo in [33] was implemented. This algorithm uses some techniques to find the best monitoring characteristics that maximize the separation of the cells between two windows. The result of this implementation let follow a track if it doesn't change the characteristics used.The real situation is that almost all characteristics could change in the time.
Subsequently the tracking Images algorithm referred like optical flow described by Shibata in [34] was tested. This algorithm is commonly applied two-dimensional systems using restriction equations derived from position and velocity of cells. In the test, the performance of the algorithms was 81% but although this percentage was acceptable, the results depended on the cells deformations. If the cells kept the shape relations the results were acceptable but in case of a shape change, the failure percent increased because the algorithm was sensible to shape deformation of the tracking objects.
Because of this, an algorithm must consider the target characteristic change between time periods. The idea was to find a unique group of characteristics for each convective cell, and make recurrent comparison between them but limited to a geographical area.The reason is clouds are slow movement system that depend mainly of wind.
In the detection phase, NN algorithm generates cells that have size, temperature distribution, temperate centroid, geographical centroid, by channel. In the identification phase the system has a group of rectangles with the information merged from all inputs. In figure 4 and 6, a different cell could be observed.
At this moment for each convective cell the system has a rectangle with a defined characteristic vector and unique tag that is georeferenced and stored. The tag is a unique alphanumeric combination, and the vector contains vertices, temperature and centroids for each cell. This data is compared with the result of the same procedure for the cells corresponding to time t-1.The one-dimension cell is represented as tagged points for each formation (figure 5).
A problem was that each rectangle could have more than one temperature centroid. According to [9] the definition of temperature centroids reguires temperatures lower than 236 °K.
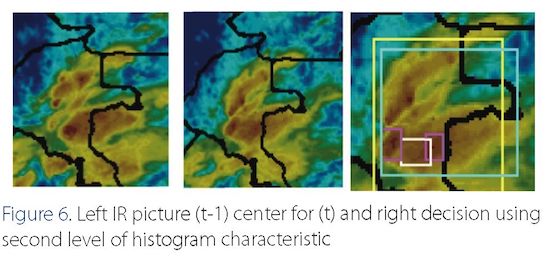
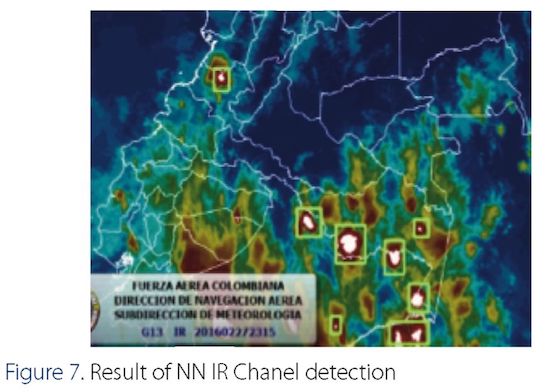
Then the system could divide by mistake a cell between lowers centroids. Because of this, the second level of verification was defined using a second layer contrast between 200 and 208 °K.That its showed in figure 6.Then the number of centroid is a characteristic of each convective cell like is showed in figure 7.
For the next time, the system creates a new georeferenced matrix with the inputs for that period and for each convective cell create a new temporally tag. After that the neighbor analysis and minimum layer distance measurement comparisons, the system chooses if any cell of the actual cells comes from cells from t-1 period. In that case the system creates a relation in the database and change the new temporally tag for the older tag indicating the relation. In order to do so, the system makes a comparison between characteristic vector (centroids positions, vertices position and temperatures) between all convective cells in a determinate radio for each time.
For radio determination in this work the typical displacement of formations in the country was characterized, validating between states t+1 and t+2 for 500 rectangles determining that in Colombia the spatial displacement of a convective cell has a radius of 0 to 9 pixels, for 30 minutes period.
The resolution of displacement per pixel is 3.48x3.34 Km, which is equivalent to a maximum displacement of 31.32 Km or 16.911447 Nm, that could be equivalent a speed displacement vector of 33.82 Nts. An error of 15 percent was defined. Then the country displacement upper limit is expressed in sped like 5.25 Nts and using S as a spatial dimension in latitude and longitude would be represented like is showed in figure 8, as:
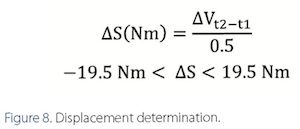
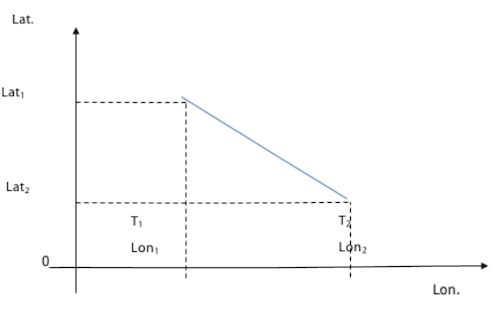
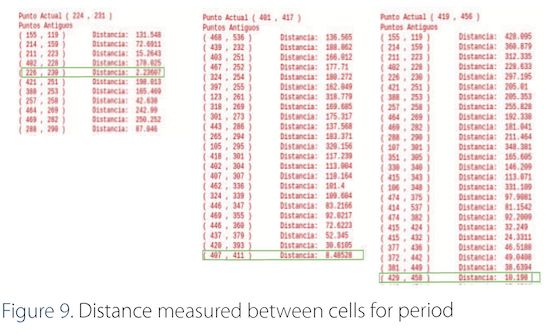
The maximum displacement distance could be represented in pixel according to source resolution like 11 pixels per period like is showed in figure 9.
The evolution of each convective cell in a time line let the system to create a unique meteorological track. For the Colombian case, according to statistics generated in this work, on a bad weather day, up to 100 formations of interest can be detected, with average wind intensities to 35 Nts, which was validated with a sample of 500 validation satellite images from the las two years. These wind vector is in accordance with the calculations made.
After that, Euclidian distance are calculated for each centroid and each group characteristic in a radius of 11 pixels for each side. This is done for each characteristic vector dimen-sion.Then a general Euclidean average is calculated.The distances are compared to obtain the shortest general distance that would be equivalent to the maximum congruence between cells among t and t-1. In case of finding more than one coincidence, the minimum distances in magnitude between centroids (temperature and geography).
When the coincidence match is found, the identification tag is inherited and characteristics such as speed, area change, deformation rate, temperature, and density are calculated, updated and stored in the matrix. If the new cell does not have precedent, then the system update tag classification from temporally to permanent.
The system could check two different phenomena, the first one is when two cells are merged in a new compose cell using these techniques and size comparisons. In this case, a label is placed indicating that it is a compounded cell. To the opposite when a one cell generates more than one in the next periods.These characteristics are stored like compose cell at the database for the current period
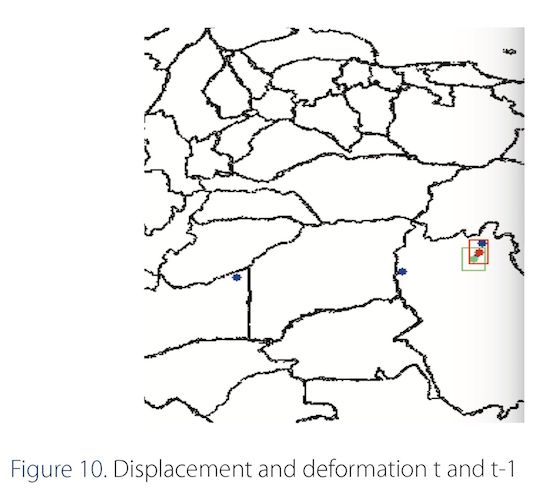
Finally, a test with 873 images of convective cells was performed in which the rectangles detected in the previous image were drawn in the new image in order to verify the behavior of the algorithm. Asa result, 99.8% of the tracking cell was measured in the test by formations that were present in the previous image as in the new one. After that, the percentage of deformation are measured and stored for each cell as shown in figure 10.To illustrate it, in the following image two consecutive analysis can be observed in the time, t and t-1 were drawn.
Based on the cell identification information, other variables can be measured and calculated, such as deformation index, temperature gradients, speed, and heading, which allow the system to establishing if the cloud is in dissipation or formation process.
For the forecast, the system must calculate affectation regions due to the formation displacement during the de time. Based on definitions of Peru's Nacional Meteorological Service [35], for nowcasting the system use the tendency for behavior prediction of the convective cell for the next 60 minutes. That kind of nowcasting could be used during brief time periods, according to references. Then the system will use this technique for creating a tracking model for the next two periods that's means the next 30 and 60 minutes. This implies that in this first approach the prediction horizon will be 1 hour.
The main factor that produces clouds movement is the wind.The wind movement is produced by pressure atmospheric changes Thus, it is necessary to know wind heading and speed to make the calculation of each cell affectation area. This method involves the calculation of the wind vector speed for all country, and use that information to infer the convective system vector speed. In order to do so, the country area has been divided into a wind cells of 10 Km like is showed in the figure 11. This information is extracted from SIMFAC barbas graph and the Metar Information. Both metar and barbas graph has a 1 hour of update time.
Then, for affectation area forecast this new matrix is defined like a new input for the cell tracking layer defined in previous step. Thus, the system uses a position of any convective cell storage in a convective cellule grid and operate this through a speed equation using a vector speed wind matrix lake speed base. If the convective cell is in an area with multiple vectors they are added to find the average vector that represent the resultant vector speed for the area. This new vector of average speed is storage in the speed matrix. In order to increase the quality of the forecast, the last three consecutive periods will be used to make an average of magnitude and direction vector.
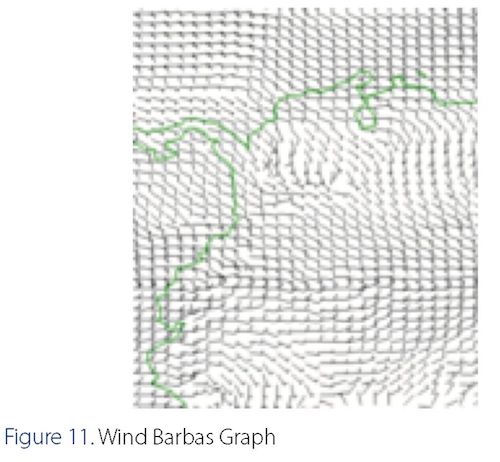
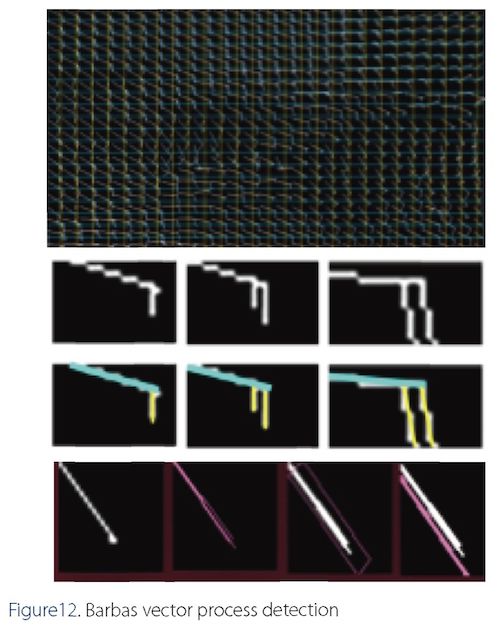
To calculate wind direction and intensity, the system uses the intensity graphs known as barbs, that are observed in picture 11. According to forecasting manual [36], the barb's graphs are used by meteorologists to know the wind vector of an intuitive way. They are composed of vectors of direction and magnitude as is showing. In this graph, the longest vector indicates the wind direction in degrees, and perpendicularly to it there will be short line segments that are additive and represent the intensity in a geographic area.
To detect this information, two processes were performed separately, the first one detects the presence of the heading line, using the Hugh transform implemented in OpenCV that is described in [37], [38]. This process allows grouping points that belong to a line, determining the angles and thresholds of this line. After the system has identified the longest line, the system has the location of each heading segment, then the Extreme points are evaluated for each segment to find the presence of perpendicular lines using the same technique to determine the magnitude of the wind for that sector. This process is shown in figure 12.
Similar process is done with a distance increment to evaluate the presence of more magnitude vectors. If they are founded, the size is compared with the media to define the magnitude of each one and these are added to find the total magnitude.
Based on this information, the position of the convective cell is projected as a function of the wind speed in a determined area. The system compares each centroid position for all convective cells with the average wind vector and thus the displacement is calculated in periods of 5 minutes generating influence curves as a function of time.
The speed is also showed in the convective cell information and can be used by the user to determinate the projected position of the convective formation in the next period. The level of seventy of the formation in the calculation of the areas of influence is conserved and extends for a period in the influence area maintain the same level until the next period.
The meteorology is a complex area because there are a lot of local aspects that could affect the evolution of the convective system. Because of these an intelligent system that could be trained for each area, could help to reduce the necessary assets to analyses these kind or phenomena.
The constant analysis of meteorological condition based on standard inputs is a repetitive issue that could be done by IA systems and computational algorithms, supporting staff decisions making, reducing costs and risks due to human error. In this case the IA system training has been done for Colombia area with identification rates over 93%. This type of development is transverse to many industries since areas such as agriculture, pest research. In that way, efforts should be made to understand the local meteorology to project climatology studies.
It can be concluded that the use of intelligent systems for the analysis of different meteorological sources strengthens the human capacities for the analysis of information and monitoring, but for the control of air operations it should only be used as a support system due to criticality of the analysis, ie it should always be validated by an expert and based on these validations could improve the results obtained.
However, the use of this technologies in accident prevention and transport are cover in this approach. In this specific application, this work starts from the imperative necessity to increase the safety condition for air operations, in order to improve the air traffic efficiency and the decisionmaking process support for CNS-ATM systems.Then integrating IA system in meteorological analysis of risks levels could be minimized and cost could be reduced through integration of different sources to give air traffic controller previous information about aircrafts route condition. Again, always this system will require an expert validation.
This kind of information nowcasting techniques could be implemented to improve the air flow to reduce operational cost. In the transport sector, this kind of development are important because, as mentioned in the document, systems that allow the control of air operations are inefficient if they do not integrate automatic systems of fusion of meteorological data in order to maximize the flow of aircraft and reduce risks.
The next step will be the communication between meteorological tracks and aircraft tracks to find de critical zones for flight in realtime. Integration information system that could operate in real time will improve the nowcasting techniques using more complex models like WRF working together with IA systems and rad.
[1] Cheng, H. (2017) Cloud tracking using clusters of feature points for accurate solar irradiance nowcasting. Renew. Energy, vol. 104, pp. 281 -289.
[2] Roy, C; Kovordányi, R. (2012) Tropical cyclone track forecasting techniques - A review. Atmos. Res., vol. 104-105, pp. 40-69.
[3] Henke, D.; Smyth, R; Haffke, C. and Magnusdottir, G. (2012) Automated analysis of the temporal behavior of the double Intertropical Convergence Zone over the east Pacific. Remote Sens. Environ., vol. 123, pp. 418-433.
[4] Sieglaffi J.; Cronce, L.; Feltz, W. (2014) Improving satellite-based convective cloud growth monitoring with visible optical depth retrievals. J. Appl. Meteorol. Climatol. 53(2). pp. 506-520.
[5] Parikh, J.; DaPonte, J.; Vitale, J. and Tselioudis, G. (1999) An evolutionary system for recognition and tracking of synoptic-scale storm systems. Pattern Recognit. Lett. 20(11 -13). pp. 1389-1396.
[6] Henken, C; Schmeits, M.; Deneke, H. and Roebeling, R. (2011) Using MSG-SEVIRI cloud physical properties and weather radar observations for the detection of Cb/TCu clouds. J. Appl. Meteorol. Climatol. 50(7). pp. 1587-1600.
[7] Yin, S.; Qian, Y. and Gong, M. (2017) Unsupervised Hierarchical Image Segmentation through Fuzzy Entropy Maximization. Pattern Recognit., vol. 68. pp. 245-259.
[8] Mahani, S.; Gao, X.; Sorooshian, S.; and Imam, B. (2000). Estimating cloud top height and spatial displacement from scan-synchronous GOES images using simplified IR-based stereoscopic analysis. J. Geophys. Res. Atmos. 105(D12). pp. 15597-15608.
[9] Rillo, V; Zoilo, A.; Mercogliano, R; and Galdi, C. (2015). Detection and forecast of convective clouds using MSG data for aviation support. 2nd IEEE Int. Work. Metrol. Aerospace, Me-troaerosp. 2015 - Proc., no. Cmcc, pp. 301 -305.
[10] Chethan, H.; Raghavendra, R.; and Hemantha, G. (2009). Texture Based Approach for Cloud Classification Using SVM. 2009 IEEE Int. Conf. Adv. RecentTechnol. Commun. Comput. (ARTCom '09), pp. 688-690.
[11] Flnke.C.; Butts, 1; Mills, R.;and Grlmalla.M. (2013). Enhancing the security of aircraft surveillance In the next generation air traffic control system. Int. J. Crlt. Infrastruct. Prot. 6(1). pp. 3-11.
[12] Ahlstrom, U. (2005). Work domain analysis for air traffic controller weather displays. J. Safety Res. 36(2). pp. 159-169.
[13] Jeon, D.; Eun, Y.; and Kim, H. (2015). Estimation fusion with radar and ADS-B for air traffic surveillance. Int. J. Control. Autora Syst. 13(2). pp. 336-345.
[14] Ahlstrom, U. and Jaggard, E. (2010). Automatic Identification of risky weather objects In line of flight (AIRWOLF). Transp. Res. PartC Emerg.Technol. 18(2). pp. 187-192.
[15] Ulfbratt, E.; and McConvIlle, J. (2008). Comparison of the SE-SAR and NextGen Concepts of Operations. NCOIC Aviat. IPT, vol. 1.0, p. 22.
[16] Brooker, P. (2008). SESAR and NextGen: Investing in new paradigms. J. Navlg. 61 (2). pp. 195-208.
[17] Martinez, J. (1998). El futuro de la gestión, la gestión del futuro. Dlr. y progreso, no. 160, pp. 82-86.
[18] Cahill, J. (2016). A Safety Impact Quantification Approach for Early Stage Innovative Aviation Concepts Application to a Third Pilot Adaptive Automation Concept, no. November, 2016.
[19] Capa, E. (2015) Universidad Politécnica De Madrid.
[20] Ramírez-Fernández, S.; Llzarazo-Salcedo, I. (2014). Clasificación digital de masas nubosas a partir de Imágenes meteorológicas usando algoritmos de aprendizaje de maquina. Rev. Fac. Ing. 1(73). pp. 43-57.
[21] Stone, M.;and Anderson, J. (1989). Advances ¡n prlmary-radar technology. Lincoln Lab. J., pp. 363-380.
[22] Weber, M. (1986). Assessment of ASR-9 Weather Channel Performance : Analysis and Simulation.
[23] Welpert, A.; Flannesen, R. (2008). Enhanced weather Information for air traffic controllers using comprehensive sensor and data assimilation procedures. Eur. Radar Conf., no. October, pp. 184-187.
[24] Flarrlngton, J. (2009). Weather services In the NextGen Era. Aviat. Int. News, no. January, pp. 34-37.
[25] McCrea, M.; Sherali, FI.; Tranl, A. (2008). A probabilistic framework for weather-based rerouting and delay estimations within an Airspace Planning model.Transp. Res. Part C Emerg. Technol. 16(4). pp. 410-431.
[26] Wiggins, M. (2014). Differences In situation assessments and prospective diagnoses of simulated weather radar returns amongst experienced pilots. Int. J. Ind. Ergon. 44(1). pp. 18-23.
[27] Peak, J. and Tag, P. (1994). Segmentation of satellite Imagery using hierarchical thresholding and neural networks. Journa of Applied Meteorology, vol. 33. pp. 605-616.
[28] Desbois, M.; Seze, G. and Szejwach, G. (1982). Automatic classification of clouds on Meteosat imagery - Application to high-level clouds. Journal of Applied Meteorology. 21 (3). pp. 401-412.
[29] Azimi-Sadjadl, M.; and Zekavat, S. (2000). Cloud classification using support vector machines. IGARSS 2000. IEEE 2000 Int. Geosci. Remote Sens. Symp. Tak. Pulse Planet Role Remote Sens. Manag. Environ. Proc. (Cat. No.00CFI37120). vol. 2. pp. 669-671.
[30] Bedard Jr., A. (2015). AVIATION METEOROLOGY | Aviation Weather Flazards, Second Edi., vol. 1. Elsevier.
[31] Senhaml. (1959). Guía De Meteorología General.
[32] Smoot, D. (2015) Global Flidrology And Climate Center. [Online]. Available: https://weather.msfc.nasa.gov/GOES/satellite-description.html.
[33] Zaccolo, M. (2002). Good Features to Track. Methods Mol. Biol. 178(Dec). pp. 255-8.
[34] Shibata, M.; Yasuda, Y; and Ito, M. (2008). Moving object detection for active camera based on optical flow distortion. Proc. 17th World Congr., pp. 14720-14725.
[35] S. N. de M. e Flldrologla, Capitulo 13. Pronóstico Meteorológico. In: GUIA DE METEOROLOGIA GENERAL, pp. 1-16.
[36] (2012) Manual del Sistema Mundial de Proceso de Datos y de Predicción.
[37] Matas, J.; Galambos.C.; and Klttler, J. (2000). Robust Detection of Lines Using the Progressive Probabilistic Plough Transform. Comput. Vis. Image Underst. 78(1) pp. 119-137.
[38] Puca, S.; Biron, D.; De Leonlbus, L; Rosci, R; and Zauli, F. Improvements on numérica I'object'detection and nowcasting of convective cell with the use of seviri data (ir and wv channels ) and neural technlqhes.